
How to Create Infographics that Win the Market Over

 7 min read
What is an Infographic?
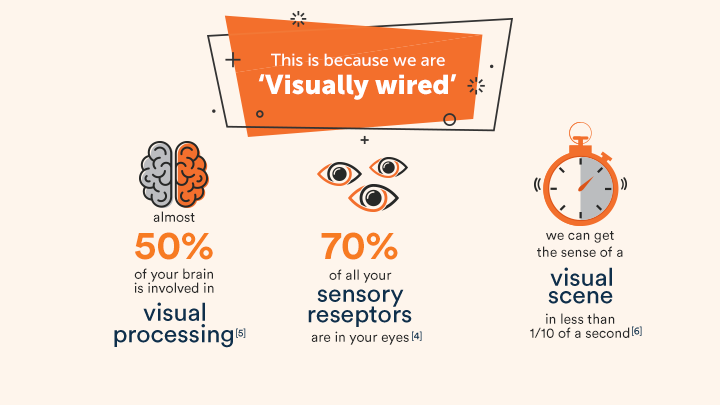
The human biology has enabled our visual perception to be the strongest comprehension tool we have. We get most of our informational input primarily through our vision. In this context, we talk about infographics. What is an infographic? Infographics are the way to convey information through graphical means. They drive into the world of marketing on the wheels of the visual power. The relationship between a customer and a company or its product is built on how the customer perceives the offer, and since vision is the strongest facet in perception, marketing infographics become a leading way to success in business.
How Does Digital Marketing Infographic Strategy Serve You?
It seems that plain text performs all the same functions as infographics. However, great infographics perform those much more effectively, for images, both still and animated, save mental effort that we spend when processing a text, and so the reader has more capacity to digest the information, and it sinks deeper into their mind. There are also extra benefits. As our visual memory works better with ever unique and interesting images, shapes, and colors than with simple, always look-alike words – educating customers about your company or educating your colleagues about your marketing goals becomes easier when it’s done via imagery. The infographic process helps you literally showcase your ideas, your principles, and history. Pictures and symbols allow the recipients to grasp the message much faster than they would through text. The infographic meaning is better realized when we think about signs on the streets and highways for pedestrians and drivers. They don’t have to stop and read about speed limits and cautions, because the signs trigger the instant understanding of the instruction. Infographics can be used as enhanced business strategy outlines, they break complex stories and concepts into smaller pieces, they help readers visually see the scale of numbers in infographic statistics, they provide a compact and concise summary or a matter, they enable your audience, as well as your business partners, share information about you in a quicker pace. All in all, infographics literally display the relationships between different points of your message by showing how they connect, visually. Besides, even fairly simple infographics are a great creative space that gives your brand a chance to acquire its original and unique graphic face.
Demand for Infographic Information
In marketing, infographics are in such demand nowadays because they provide velocity and volume. They spread the word about your service, product, or campaign faster. They say more by saying less, putting all the important words into an appropriate picture or graphical scheme. Business growth entails expansion, and the realm of graphical communication provides a great expansion of variety – the variety of ways to offer your services and express your ideas, also with more precision. After all, if your competitors use infographics, why should you lag behind?
What Does Infographic Mean for SEO and Link Building?
When web users search for information, they are more inclined to click on images rather than links to standard articles when viewing the search results. In tandem with appropriate keywords, infographics have the moth-to-a-flame kind of appeal when it comes to SEO. The same goes for link building: visuals have a drastically bigger shareability than traditional textual information. Infographics are also interesting and useful additions for a blog post and expert articles in your niche, and when you reach out to writers that can potentially cooperate with you, they may happily agree to place your infographics on their website with a link back to you.
Types of Infographics
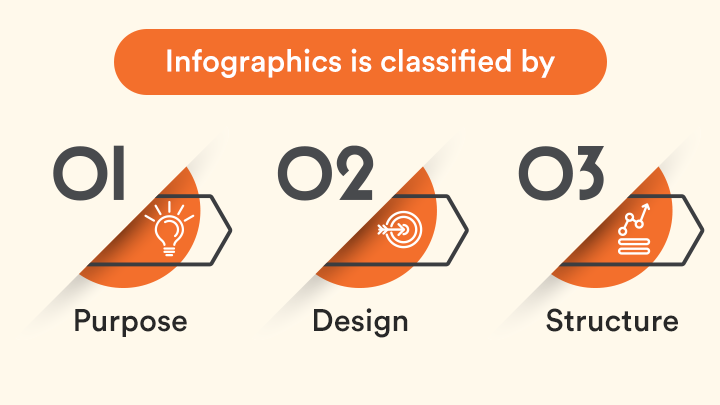
Different types of infographics are actually interlacing all the time, for they can be classified by purpose, structure, and design, among other aspects. Infographics can be: 1) more data-oriented or 2) design oriented. Pretty much all the types can be adapted for either purpose. 3) Data visualization includes infographic numbers, statistical infographics, demographics, etc. expressed in graphs, schemes and sectored circles of any infographic designs you can come up with. The items in the visuals can be structured 4) hierarchically, 5) chronologically (as a timeline infographic, whether predicting future tendencies or narrate the development of a subject in the past), and also as 6) an infographic flowchart, which is often used in 7) interactive infographics, where the readers can navigate through the information in the manner that fits their needs. Infographics can be 8) anatomical and analyze parts of an issue or matter – for example, different regions can be shown as parts of a map, and there can also be pictures of details of an actual object, briefly described one by one. Infographics can also be 9) instructional, providing step-by-step tips while using loads of arrows and interconnecting lines. Your visual information can be presented as a 10) list of items, all of them necessarily grouped together by some feature, like the same font or layout of information. Infographics also serve for 11) comparison or contrast. Every other infographic can be 12) picture-oriented, concentrating predominantly on pictures or photos as the main messengers.
How to Do Infographics
To create a successful set of the best infographics, you need first to determine what type of visual presentation fits best the purpose that you pursue, taking into account the kind of impact you want to have on the readers. Research and gather all the necessary information, always verified. A wise step is to insert a couple of relevant quotes or some kind of official numerical data, if applicable. This adds extra credibility points to your information. Remember, the visuals still have to be supported by the text. In comics, the Marvel heroes’ actions make little sense without words that guide us through the story, because the task of infographics is not necessarily to substitute the text – its task is to complement it and help it carry out the message. To build the visuals, you can use free infographic templates on the web, a free infographic maker, your own skills, or order infographic design from professionals. You can subtly supplement the visuals with links to your website or with your brand’s logo to make them serve as invitations for the audience to visit you. The next step is to strategically place the information on those platforms and send them to those partners and affiliates that will facilitate reaching your goals.
How to Create the Best Infographic
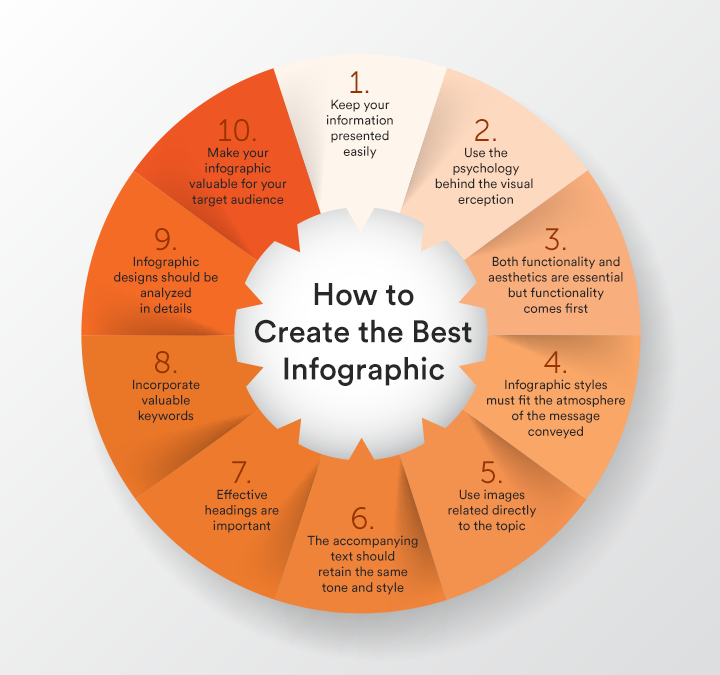
How to make an infographic that is successful? 1) Don’t cross the line between keeping them engaging and turning them into an eyesore. It should be easy for the reader to perceive the information, and that’s why the items in the visuals must be in harmony with each other and have their space, and they also should be grouped into clearly divided categories, if applicable. The reader should be able to concentrate on one point of information at a time. 2) Use the psychology behind the visual perception: for instance, rounded shapes, symmetry, matching colors are more pleasing to the eye thanks to certain subconscious associations. You can notice this in many infographic examples. 3) If it’s hard to properly combine functionality and aesthetics, functionality comes first, because your infographics are created for a practical purpose. 4) Your infographic styles must fit the atmosphere of the message conveyed. 5) Use images of things directly associated with the topic of your infographic as backgrounds or bodies for graphs and scales. 6) The accompanying text should retain the same tone and style all along so that the reader can connect all the diverse information to a single stable line of narration. 7) Don’t forget about effective headings, they can be as powerful as images in their ability to grab attention and leave impressions. 8) Incorporate valuable keywords – a new format is not a reason to discard them. 9) In preparation for the creation of the infographics, analyze the prospective effectiveness of your infographic designs in regards to the target audience. In some cases, even the font of the text can be an ick factor. 10) Analyze how to make your infographics valuable for your current and potential business partners, because their part in sharing your visuals may be quite beneficial to both of you.
What is Infographics Value for Your Business
You can use infographics in your business in various useful ways:
1) reboot your old content and presented it to the reader in a more accessible and engaging format;
2) enable your content to spark more interest among potential customers and partners;
3) increase the shareability of your content, which gives a prospect of a wider audience and a bigger number of subscribers/customers;
4) faster promotion of your new campaigns, services, and products;
5) improve the quality of work in your team by using infographics in your business communication;
6) rewire your own way of looking at business matters and opening your new, broader and clearer, strategic and troubleshooting vision.
Infographics are a faster way to conquer the market and help the customer see the benefits of choosing your product. The base on which this visual approach rests is quite simple, it comes from the biology of our brain. Using infographics, we appeal to the best mechanism of information exchange – the one empowered by nature. To think powerfully, think visually, and you will know how to do infographics well.
Here at Writology, we help you create powerful visual content from A to Z, expanding your ideas through professional research and coating them in our smart design. If needed, you can order infographic design specifically adapted for social media.
